Analytics must inform decisions about how and where to spend marketing and sales dollars. There are four variables in the equation for Pipeline Velocity. If one of these variables can be improved, you make more money.
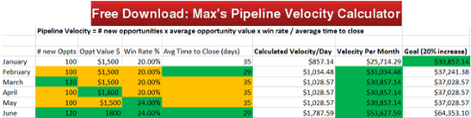
Download this resource: A simple pipeline calculator in excel to help you track your goals and the impact on revenue. (Click the image)
HubSpot has recently launched a user friendly data visualization platform allowing executives, marketers and sales managers to make more data driven investments.
Methodology: My role is to create four dashboards, each with 6-8 “visual tiles” related to the pipeline velocity equation. These dashboards will be used to take your marketing automation data on the offensive.
I will also provide recommendations on how to improve your Customer Data Model (what you collect about buyers and how you use it to inform decisions) and tactics for increasing your pipeline velocity.

Important questions to be addressed:
Important questions to be addressed
Important questions to be addressed.
Important questions to be addressed: